Education — Research
LightBox
Exploring vast digital collections in 3D space — both up close and at scale
Client: CWRU Department of Music / IC Fellows Cohort
Challenge
Researchers and students working with vast digitized collections — music cover art spanning centuries, biomedical patents, de-identified patient data — need to see both individual items in detail and patterns across entire datasets. Traditional 2D screens force a choice between zooming in and stepping back.
Solution
LightBox lets teams of researchers share the same three-dimensional data space simultaneously. Users upload curated datasets via spreadsheet, then collaboratively arrange, query, sort, and tag digital content — resizing items, rearranging clusters, and live-tagging research annotations that save directly back to the source data. The result: a shared examination of both individual items and large-scale trends that flat screens simply cannot reveal.
Results
- •Enables simultaneous close-up and large-scale dataset exploration
- •Live tagging saves annotations directly back to source spreadsheets
- •Applied to music history, biomedical patents, and patient data visualization
- •Developed through CWRU's Provost-sponsored IC Fellows program
- •Audio and AI integration planned for next phase
The Challenge: Seeing the Forest and the Trees
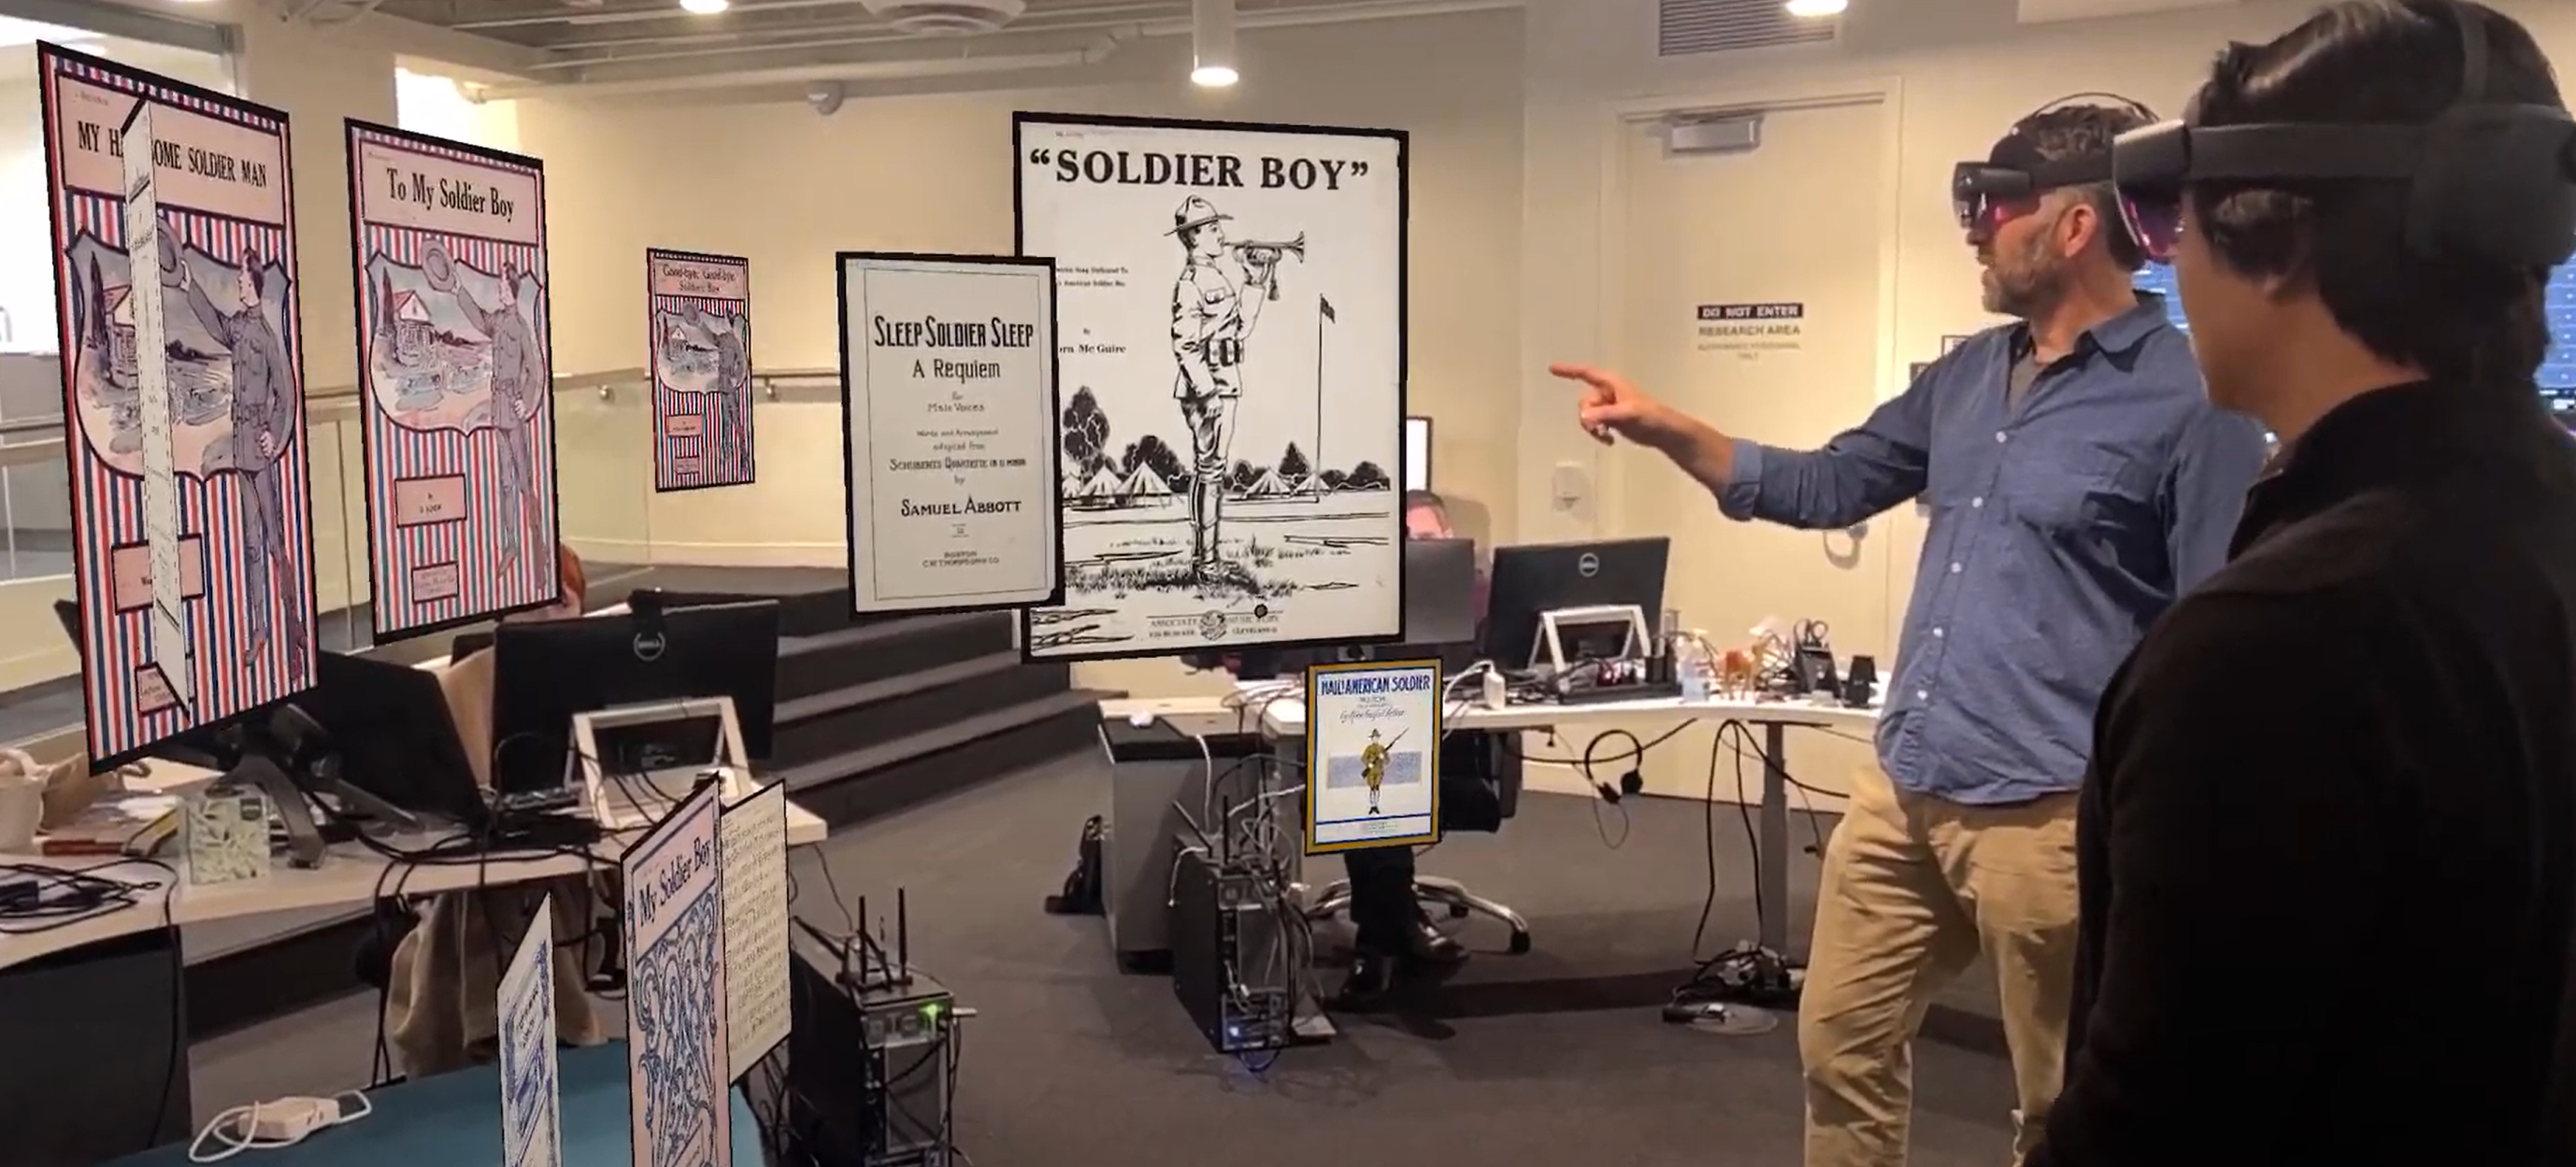
Professor Daniel Goldmark studies popular music history through cover art — thousands of images spanning centuries, drawn from sources like the Library of Congress. The challenge is fundamentally spatial: he needs to examine individual pieces in fine detail while simultaneously tracking trends across the entire collection. How did visual styles evolve? When did certain motifs emerge? Where do cultural movements show up in design?
Traditional tools force a painful trade-off. Spreadsheets show metadata but strip away the visual. Image browsers show the visual but bury the context. And neither lets you see the shape of an entire collection at once — the clusters, the outliers, the patterns that only emerge at scale.
The Solution: A Research Lab in 3D Space
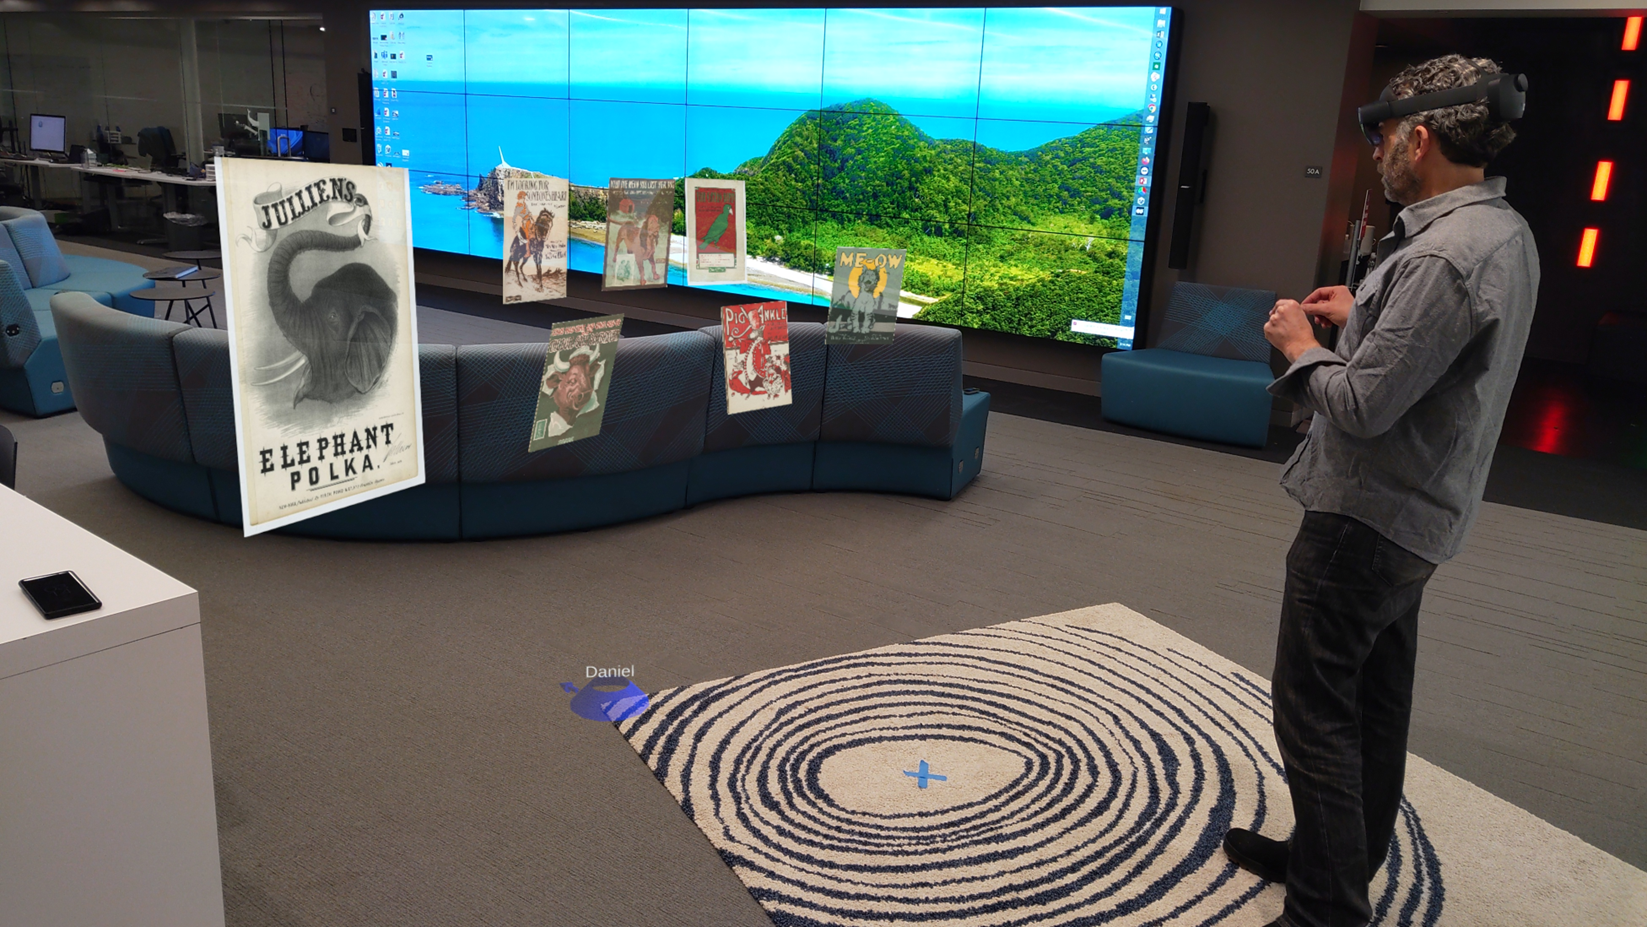
LightBox transforms dataset exploration into a spatial experience. Users upload a curated CSV with content metadata — titles, authors, dates, links to digital files — and the entire collection materializes in 3D space around them.
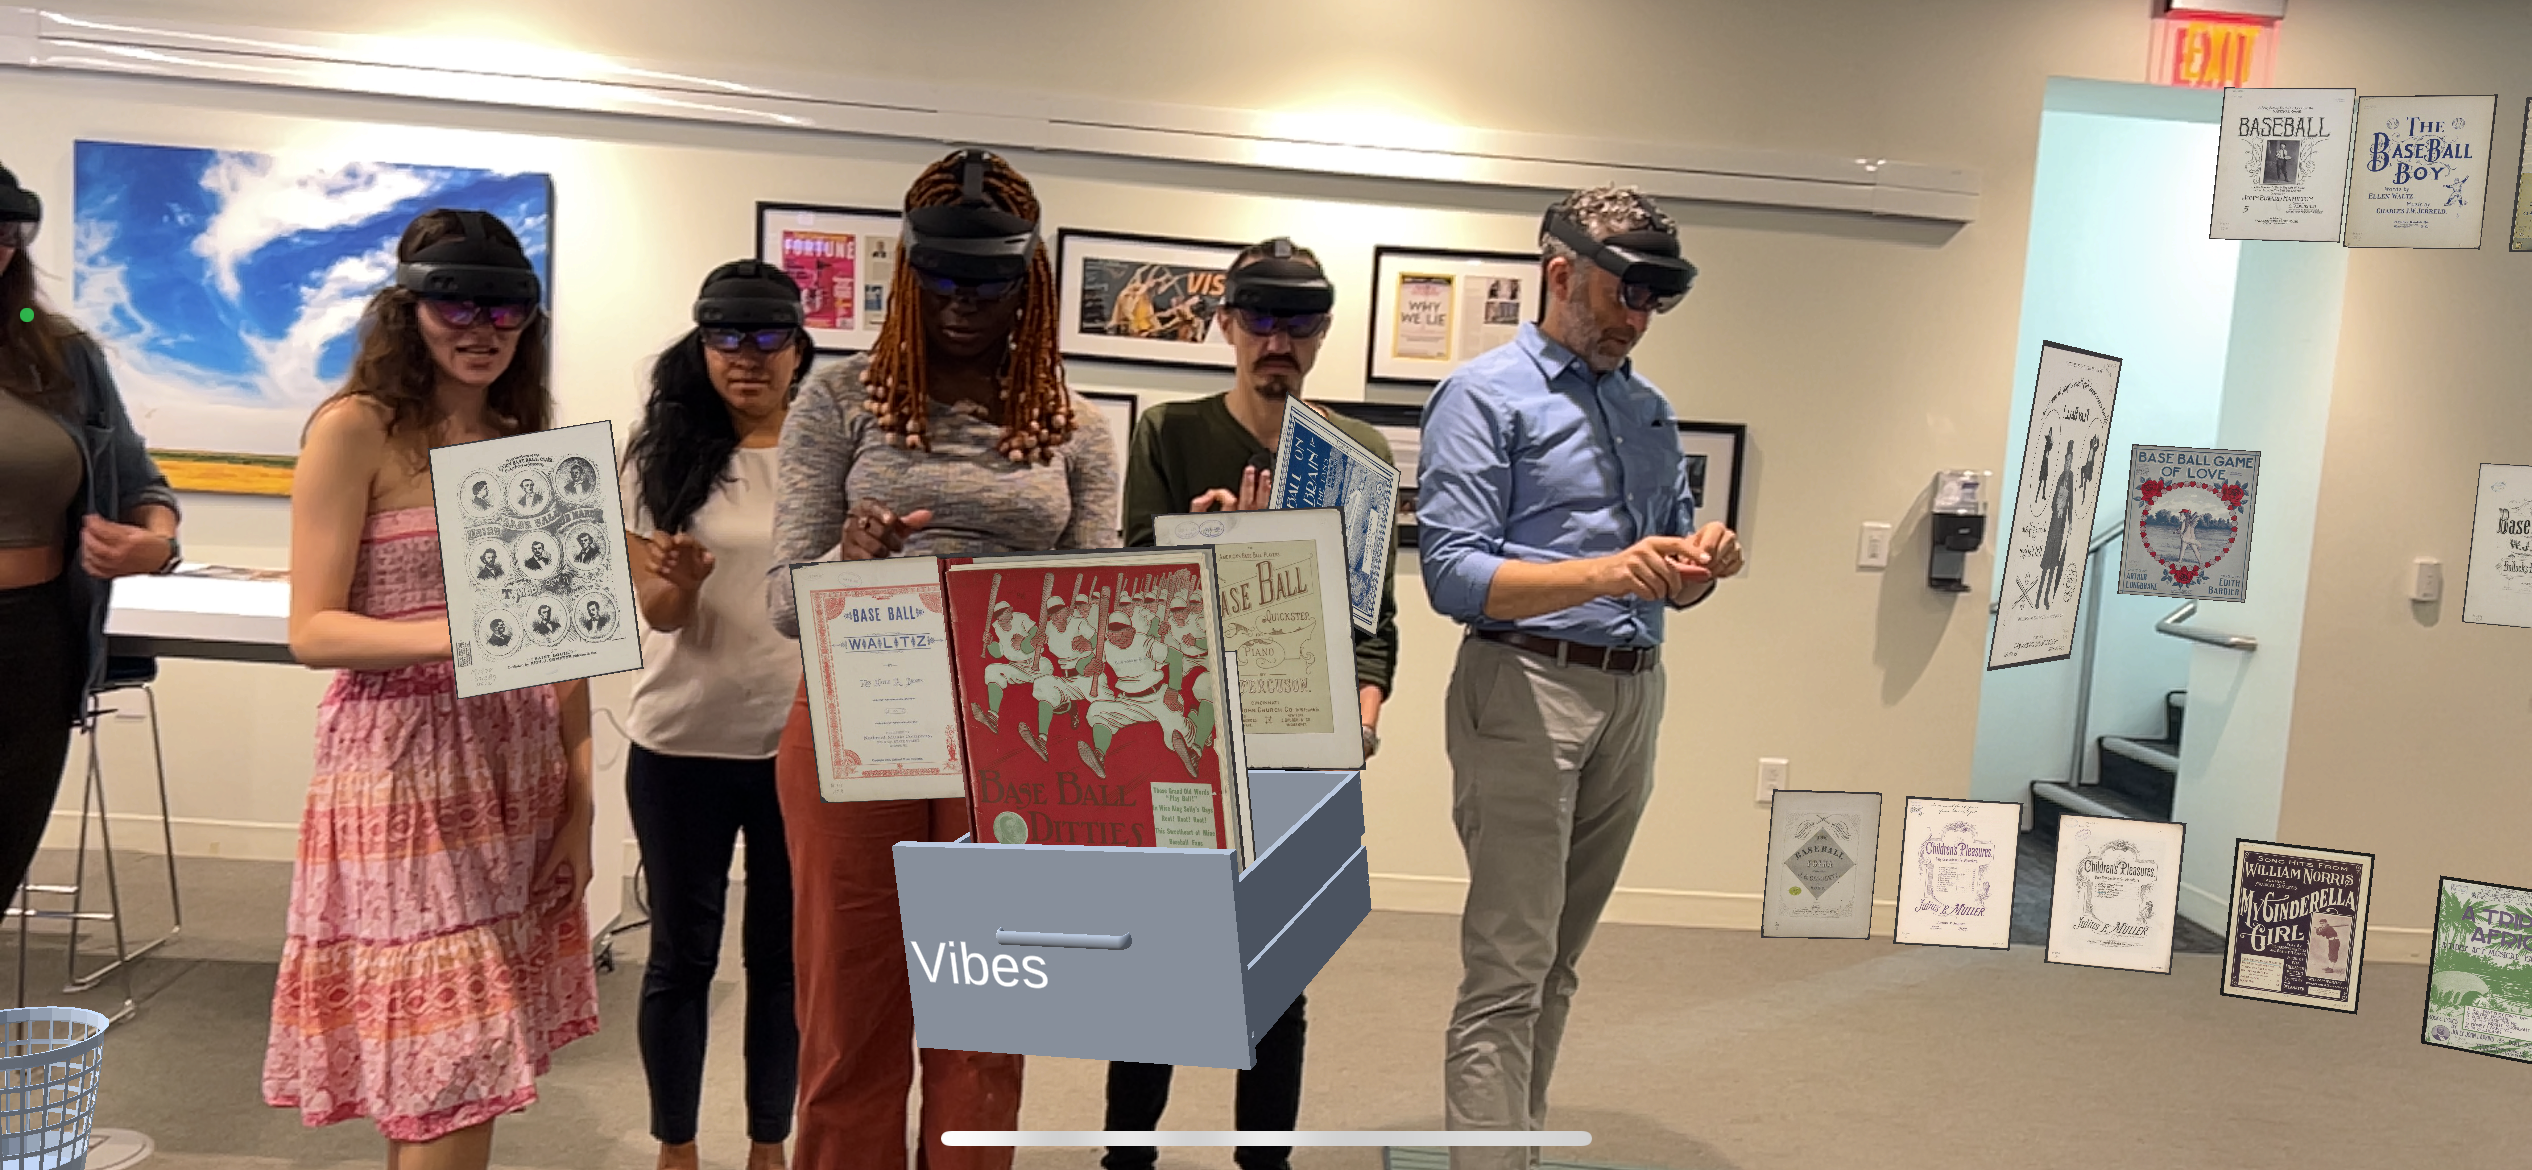
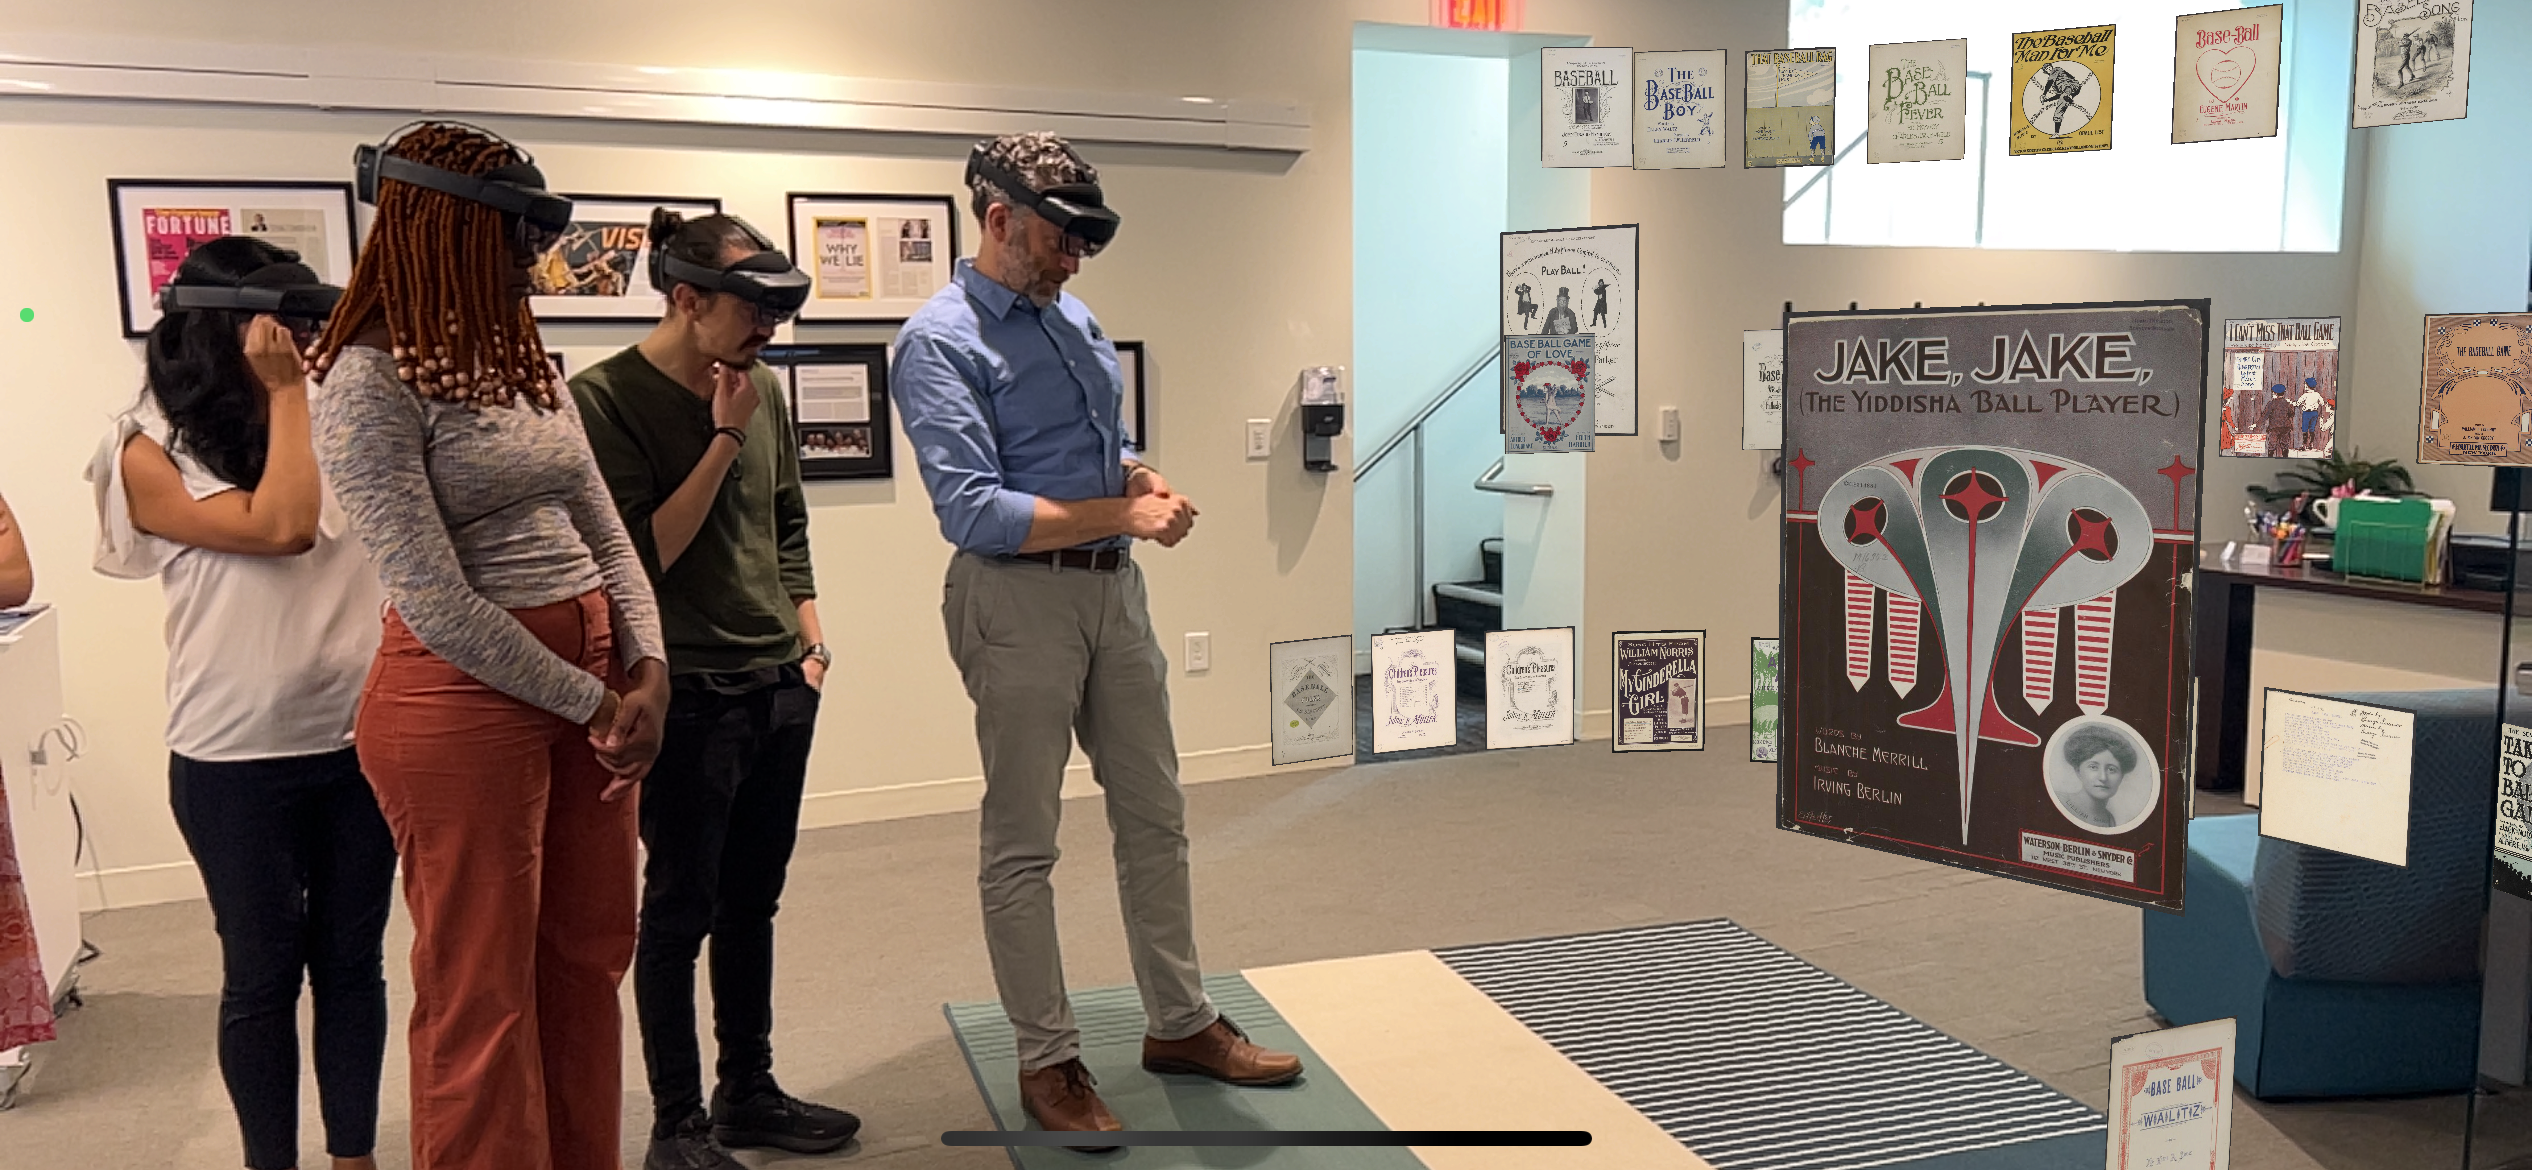
Students can rearrange items by any dimension: cluster by decade, sort by genre, group by visual similarity. They can scale individual items up to examine fine details, then pull back to see the entire collection at once. The "live tagging" feature lets researchers annotate items in real time, with tags saving directly back to the original spreadsheet — no separate annotation tool, no lost context.
The application has already proven its value beyond music history. Biomedical researchers use it to visualize patent landscapes. Clinicians explore de-identified patient data in 3D, spotting correlations that tables and charts obscure.
The Impact: From Music History to AI-Powered Discovery
LightBox demonstrates a principle at the heart of CrewXR's approach: when you give people spatial tools for inherently spatial problems, they see things they couldn't see before. A music historian spots the emergence of psychedelic design three years earlier than the conventional timeline suggests. A biomedical researcher identifies a cluster of related patents that text-based search had missed.
The next step is transformative: using CrewXR to integrate AI that understands the collection. Imagine an AI research assistant — built on the platform — that can answer questions like "Show me all covers that reference jazz iconography" or "Which patents in this cluster cite the same foundational work?" — not by searching metadata, but by understanding the content spatially and semantically. The dataset becomes a conversation.
“I needed an effective method to explore these vast digitized collections — both up close and at scale.”